Research
HJOG 2024, 23 (1), 32-47| doi: 10.33574/hjog.0548
Panagiotis Fotinopoulos1, Sotirios P Fortis2, Louiza G Mahaira2, Maria Salagianni3, Vasilios Pergialiotis1, Georgios Daskalakis1, Nikolaos Papantoniou1, Aris Antsaklis1, Kalliopi I Pappa1
11st Department of Obstetrics and Gynecology, University of Athens, Medical School, Alexandra Hospital, Athens, Greece
2Cancer Immunology and Immunotherapy Center, Saint Savas Cancer Hospital, Athens, Greece
3Clinical Experimental Surgery & Translational Research, Biomedical Research Foundation Academy of Athens, Athens, Greece
Correspondence: Panagiotis Fotinopoulos, 92, Vasilisis Sofias Avenue, 11528, Athens, Greece, Tel.: +30 6949066870, E-mail: pfoteino@med.uoa.gr
![]()
Abstract
Background and Objectives: Intrauterine growth restriction (IUGR) is worldwide a public health problem. IUGR-born individuals acquire epigenetic “thrifty-phenotype” gene adaptations, according to the “Barker hypothesis” and are more susceptible to develop metabolic related diseases. Small for Gestational Age (SGA) fetuses consist of a transitional group between IUGR and normally grown fetuses (Appropriate for Gestational Age, AGA). Currently, there is limited information in the literature whether IUGR or SGA status affects the pluripotency of the Umbilical Cord Mesenchymal Stem Cell (UC-MSC) with respect to gene expression at various stages of cell culture.
Materials and Methods: In this study, we investigated stemness marker expression in UC-MSCs derived from twenty-one AGA, IUGR, and SGA fetuses. The relative expression of key genes involved in stemness, pluripotency, and cell proliferation, namely IGF2BP1, CMYC, GLI1, P21, NANOG, OCT4, and SOX2, was assessed in UC-MSCs at passages P0 and P1 using flow cytometry and quantitative PCR.
Results: We found lower median expression levels of IGF2BP1 in IUGR group (P=0.044) and P21 in SGA group (P=0.024) at P0 compared to control group. GLI1 and OCT4 exhibited reduced expression at P1 in the IUGR group (P=0.0434 and P=0.0343 respectively) compared to AGA. NANOG median expression differed statistically between CONTROL and IUGR group in P0 (P=0.034) and P1 (P=0.0205). No significant changes were noted for SOX2 and CMYC median expression among the various groups in P0 and P1.
Conclusion: The comparative analysis of stemness marker expression among UC-MSCs from these three different sources is a novel descriptive aspect of our study, adding a new perspective to the existing literature.
Keywords: IUGR, IGF2BP1, P21, NANOG, GLI1, OCT4, SOX2, CMYC, UC-MSC
Introduction
The arrest of fetal growth is referred to as Fetal Growth Restriction (FGR) and is a public health problem affecting approximately 10–15% of pregnant women, observed in 23.8% of the newborn. Approximately 30 million babies in developing countries suffer from FGR annually. In Fetal Growth Restriction the embryo cannot reach its inherent developmental potential. Sonographically, growth in the third trimester is deviated from its expected orbit and the estimated fetal weight remains below the 5th Percentile in reference growth charts. Recently, Intrauterine Growth Restriction (IUGR) has been replaced by FGR therefore, in this study both terms are used as synonyms. Early-onset FGR (EoFGR) emerges before 32 weeks of gestation and is attributed to severe placental insufficiency1. It complicates 1% of gestations and often coexists with preeclampsia. A series of dynamic changes in fetal doppler spectral waveforms in Umbilical Artery (UA), Middle Cerebral Artery (MCA) and Ductus Venosus (DV) occur as placental perfusion worsens in conjunction with a decelerated growth. These changes reflect a temporary fetal circulatory redistribution of perfusion to the “precious organs” which include brain, heart and adrenals (“Brain-Sparing Effect”). This gradual decrease in the kidney perfusion eventually leads to reduced amniotic fluid prior to the decompensation1. Late-onset FGF (LoFGR) emerges after 34 gestational weeks while it is related to mild placental insufficiency. The growth rate in reference charts is flattened and remains under the 5th Percentile however, the doppler waveforms are unaffected. The dimensions of the fetus and the absolute fetal perfusion per minute are higher compared to EoFGR which precludes, redistribution adaptations. The transient classification group of relatively small fetuses with smooth growth orbit (5th-10th Percentile) are defined as Small for Gestational Age (SGA). Fetuses with normal growth are mentioned as AGA (Appropriate for Gestational Age), an acronym that resembles the SGA one.
Four decades ago, Barker after a series of epidemiological studies in England formulated the Barker hypothesis2. According to this hypothesis, a poor nutritional status during intrauterine life (observed especially during past famine historical periods) could provoke a series of permanent gene expression adaptations, which fit to a “Thrifty-Phenotype”. These responses seem to work well with low caloric intake and low substrate supplementation, but are inappropriate for a rich caloric intake and abundant nutritional environment3. Today, this hypothesis has been confirmed and expanded, including a series of adult metabolic diseases like Diabetes Mellitus Type II, Arterial Hypertension and Metabolic Syndrome. These disorders are currently attributed to epigenetic changes due to poor intrauterine nutritional status4-6.Gene expression can be altered without interfering with genetic composition of DNA (base sequence) through three well- known epigenetic mechanisms: A. DNA base methylation and demethylation, B. Histone modification and C. Small noncoding RNAs, (miRNAs).
Mesenchymal stem cells (MSCs) were initially studied in the ‘70s by Friedenstein et al in the bone marrow (BM) as cells with self-renewal and differentiation potential7. Since then, great progress has been made and MSCs have been found in almost all tissues, including umbilical cord (UC-MSC). MSCs possess immunoregulatory, unique immunophenotypic and tissue-repair capacity. Several studies have shown that MSCs are capable of migrating directly to specific tissues, a phenomenon known as homing. The tropism property of MSCs into injury sites and tumors makes them ideal vehicles for targeted tumor therapy and tissue engineering however, the exact mechanism of MSCs homing is still unknown8.
Collecting Umbilical Cord Mesenchymal Stem Cells (UC-MSC) from waste tissues of delivery process is not invasive in nature and without ethical dilemmas. Public and private stem cell banks began worldwide to commercial advertise and encourage future parents to invest on the potential therapeutic efficacy of these UC-MSC cells through storage, processing and deep freezing. Previously, we have investigated the role of IGF2BP1 upon interference when UC-MSC were cultured from fetuses with normal growth (AGA). Decreasing levels of IGF2BP1 lead to decreased cell proliferation, lower CMYC and GLI1 expression levels and increased P21 expression levels under the epigenetic control of TET1/2 demethylases9.
However, it still remains to be clarified whether UC-MSC sampled from AGA, IUGR and SGA fetuses share the same biological features. Therefore in this study, we sought to investigate the relative expression of IGF2BP1, CMYC, GLI1, P21, NANOG, OCT4 and SOX2 known to be involved in the stemness, pluripotency, and cell proliferation at passages P0 and P1 in UC-MSC from AGA, IUGR and SGA fetuses.
Materials and Methods
For the purpose of this study twenty-one embryos (M1-M21) from the 1st Department of OB/GYN, University of Athens, “Alexandra Hospital” were enrolled. Ten were assigned to IUGR (FGR) group, three to SGA group and eight to AGA group (CONTROL) according to the aforementioned estimated growth criteria. There were two twin pregnancies: one dichorionic (samples M5 and M6) and one monochorionic – diamniotic (samples M15 and M16). The total number of the pregnant women assessed was nineteen (P1-P19) (Table 1). Mean maternal age was 32 years for AGA, 27 years for SGA and 31, 5 years for IUGR group.
All women in the pathologic branch (IUGR, SGA) were admitted for close prenatal clinical surveillance in the “High-risk pregnancy” department of the clinic. They underwent laboratory blood analysis, biochemical testing, cardiotocographic control, ongoing sonographic growth assessment and doppler velocimetry. Birth was appointed by morning routine Cesarean Section (CS) in the optimal gestation week and under optimal workflow conditions according to the clinical protocols of 1st Department of OB/GYN. The women in the CONTROL branch had an appointment forcesarean section due to previous CS. They also underwent routine laboratory blood analysis and biochemical testing at the admission. No oxytocin was used. Epidural anesthesia was used, where medication exerts no systematic affects. All donors were informed and had signed a consent form. All procedures had prior approval from the Research Ethics Committee of Alexandra Hospital. Furthermore, at the time of sample collection, all donors were free of disease.
Tissue sampling and transport
About ten centimeter of umbilical cord was sampled from placental end (rich in MSCs) under sterile conditions and embedded in Falcon containing PBS 5% v/v Fetal Calf Serum (FCS) Solution. Within short time the sample was transported under strict thermal conditions in the “Cancer Immunology and Immunotherapy Center”, Saint Savas Cancer Hospital, Athens. The physical distance between both hospitals is short and the laboratory where sample processing would take place was synchronized for readiness.
MSC isolation and culture
UC-MSC isolation was carried out according to our previous study9 with the following modifications: under sterile conditions in Laminar Flow Chamber BH-EN-2004 (Faster, Italy) received UC was rinsed twice in PBS-Dulbecco (Merck SA, Greece). A hematoma-free piece of 5 cm was dissected and the blood vessels were removed. The remaining tissue was cut into small pieces and plated out in a T175 culture flask (Greiner Bio-One, Merck SA, Greece) in complete medium of αΜΕΜ with 20% v/v FCS and 1% Pen/Strep antibiotic mixture. For smooth cell proliferation and development, incubation was carried out at 37°C, in a gas mixture of 95% air and 5% CO2 within incubation chamber (Thermo Scientific, USA). After 24h, small pieces were removed and culture material was renewed every 3-4 days. Cells were observed in reverse optic microscope (Euromex, Holland). This timepoint is referred to as Passage 0 (P0). Two to three weeks upon initial plating, dense colonies were formed, and the first re-culture was performed. This timepoint is referred to as Passage 1 (P1). Cells were trypsinized in 0.25% trypsin-ethylenediaminetetraacetic acid (EDTA) (1x, Gibco) solution for 5 minutes to allow detaching and re-plated in complete medium with a cell density of 250/cm2. Medium was replenished twice a week and further passage was performed when cells reached 80% confluence. The remaining cells were deeply frozen to -80oC for less than 6 months9.
MSCs were cryopreserved in 10% dimethyl sulfoxide (DMSO) together with fetal calf serum (FCS), to sustain cell viability. The DMSO serves as the cryoprotectant to prevent formed ice crystals. No differences in cell recovery and viability from various fetuses were observed after thawing among the three groups.
At P0 and P1 passage, when cells reached about 80% confluency, were sub- cultured to ensure proper growth and health, since high cell density inhibits the mesenchymal proliferation rate. The IUGR samples delayed to reach density levels compared to the other samples, however this was not addressed. This could be attributed to the slicing and placement of the umbilical cord within the flask. The exact number of mesenchymal stem cells contained per tissue varies greatly amongst the donors as this is an endogenous characteristic for each individual. Slight differences on the initial umbilical tissue placed in culture could magnify further variations. However, these differences also apply to control samples. Pure mesenchymal stem cell population, confirmed by flow cytometry, isolated and cultured at passages P0 and P1 proliferated similarly amongst the groups and had no apparent deviations.
Cell counting and viability determination
Trypan blue staining was used for the assessment of cell survival rate, as it can pass the cell membrane only in dead cells and stain them blue. Cell counting was performed in Neubauer counting chamber and visualized under a microscope.
Phenotypic and functional characterization
The population doubling time (TD) was calculated as previously described6 using the known equation: TD = ln2 ·Dt/(lnNt – lnN0), where Dt is the time for which the culture was allowed to grow and N0 is the cell number in the inoculum, while Nt is the cell harvest number. The population doubling (PD) was calculated by the equation: PD = (logNt – logN0)/log2, where N0 is the inoculum cell number and Nt is the cell harvest number. The growth index (GI) was calculated using the following equation: GI = Nt/N0, where N0 is the inoculum cell number and Nt is the cell harvest number. The cumulative GI (cGI) was calculated using the following equation: cGI = GIn · GI (n – 1), where n is the passage number.
Cells were collected from the culture and rinsed in flow cytometry (FACS) buffer solution 1xPBS + 2% FBS + 0.1% Sodium azide (N3Na). An appropriate number of cells (105) was incubated with specific antibodies for 15 minutes at room temperature. Immunoluminesensce reaction was carried out in a 100μL final volume. The concentration of the antibodies used was predetermined after titration. All anti-human MSC antibodies used were purchased from Biolegend™: CD45-FITC (Clone: HI30), CD44-PE/Cy7 (Clone: BJ18), CD11b-APC/Cy7 (Clone: ICRF44), HLA-DR-PE (Clone: L243), CD90-Briliant Violet 421 (Clone: 5E10), CD105-APC (Clone: 43A3), CD73-PerCP5.5 (Clone: AD2). MSC are CD45, CD11B, HLA-DR negative and CD105, CD90, CD44, CD73 positive. After 15 minutes incubation, cells were rinsed twice in FACS buffer solution for the removal of unbound antibodies. Cells were diluted in 1% PFA + PBS solution in a final volume of 200 μL. The expression of surface markers for the characterization of MSCs was then assessed by flow cytometry on a FACSCanto II (BD, Becton Dickinson Biosciences, NJ, USA) and analysis was carried out with FACS DIVA™ and FlowJo-V10® software. Negative and FMO (Fluorescence minus one (FMO) controls were used to help set gates for flow cytometry.
RNA isolation and quantitative RT-PCR analysis
RNA isolation and quantitative RT-PCR analysis. Total RNA was extracted from MSCs using the Nucleospin RNA II kit® (Macherey-Nagel GmbH& Co, Dueren, Germany, according to the manufacturer’s instructions. Photometric assessment of total RNA concentration was done with measurement of optical density (OD) in 260 nm and 280 nm. 1 μg of total RNA was used for cDNA synthesis (complementary DNA) with the use of PrimeScript RT Reagent Kit (Perfect Real Time) (TaKaRa) according to the manufacturer’s instructions on a SimpliAmp Thermal Cycler, (Thermo Fisher). Quantitative RT-PCR (qPCR) was performed in Real Time PCR QuantStudio 5® (Thermo Fisher Scientific, USA) according to the manufacturer’s instructions using specific primers for MSC genes of interest (IGF2BP1, NANOG, SOX2, GLI1, P21, CMYC, OCT4) and the housekeeping gene GAPDH (Table 2). The final volume of reaction per sample was 20 μL. Two hundred nanograms of cDNA in 2 μL solution were mixed with 10 μL of KAPA SybrFast qPCR kit (Kapa Biosystems, Boston, MA), 6,8 μL of PCR-grade water, 0,4 μL of 10μΜ forward primer, 0,4 μL of 10 μΜ reverse primer 0,4 μL of 50x ROX High/Low. PCR conditions were the following: Enzyme activation with one cycle in 95 oC for 20 sec, 40 cycles of each 41 sec (95 oC for 1 sec, 54-60 oC depending of the primer pair for 20 sec, and 72 oC for 20 sec) for denaturation – annealing-extension- data acquisition and one cycle in 95oC for 1 sec for dissociation. To confirm amplification specificity, a melting curve analysis was performed at the end of each cycle. The DDCt method was used for data analysis of gene expression levels, as previously described9. GAPDH was used as housekeeping gene. The mRNA levels of the genes investigated in MSCs were normalized to normal umbilical cord mesenchymal stem cells (Umbilical cord-derived mesenchymal stem cells, UC-MSCs).
Statistics
Non Parametric Mann-Whitney U-test, Two-tailed, was performed using GraphPad Prism® version 8.4.3 for Windows, www.graphpad.com). The minimum level of significance was set at 0.05 (*P <0.05).
Results
Perinatal Characteristics
Comparisons of the median values of the gestational ages at delivery (IUGR vs CONTROL: 35.80 vs 37.55 weeks, P=0.1272, SGA vs CONTROL: 36.3 vs 37.55 weeks, P=0.2970 and IUGR vs SGA: 35.8 vs 36.3 weeks, P>0,99) showed no apparent differences (Figure 1).
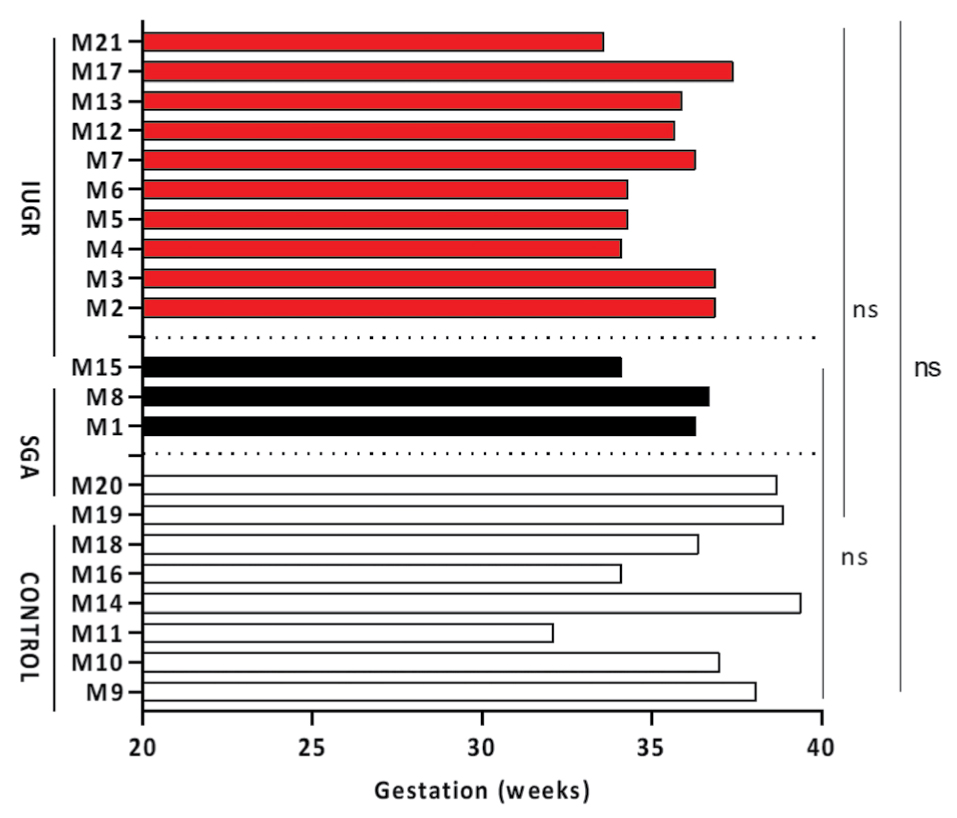
Figure 1. Gestational weeks on delivery among all groups. Horizontal color columns represent individual values from different samples (numbered M1-M21) of each source (Red: IUGR, Black: SGA, White: CONTROL). Ten mothers were assigned to IUGR group, three to SGA group and eight to CONTROL group. Numerical values of gestational weeks on delivery for each sample are also depicted on Table 1, third column. Non-parametric Mann-Whitney U-test, two tailed was used to perform statistical analysis. Statistical differences P>0.05 are referred to as non-significant (ns).
When median values of the birth weight were compared (IUGR vs CONTROL: 1750 vs 2885 grams, P=0.0021, IUGR vs SGA: 1750 vs 2320 grams, P=0.077 and SGA vs CONTROL: 2320 vs 2885 grams, P=0.0848) only control group (AGA) and IUGR differed. The absolute values of birth weight (Figure 2A) in grams were converted into percentiles according to the Hadlock standard prenatal growth charts with Astraia® software. Comparisons of the median percentile values (IUGR vs CONTROL: 2.3 vs 33.6, P<0.0001, IUGR vs SGA: 2.3 vs 8.6, P=0.007 and SGA vs CONTROL: 8.6 vs 33.6, P=0.0121) showed statistical significant differences among all groups (Figure 2B). APGAR score reflects the well-being of the newborn during delivery after the assessment of five clinical variables (Appearance, Pulse, Grimace, Activity and Respiration) where each parameter can take 0, 1 or 2 points. Maximal score is 10. Comparisons on the median APGAR scores (IUGR vs CONTROL: 8.00 vs 8.00, P=0.361, IUGR vs SGA: 8.00 vs 9.00, P=0.279 and SGA vs CONTROL: 9.00 vs 8.50, P=0.909) showed no statistical significant differences confirming the optimal perinatal outcome among all groups (Figure 2C).
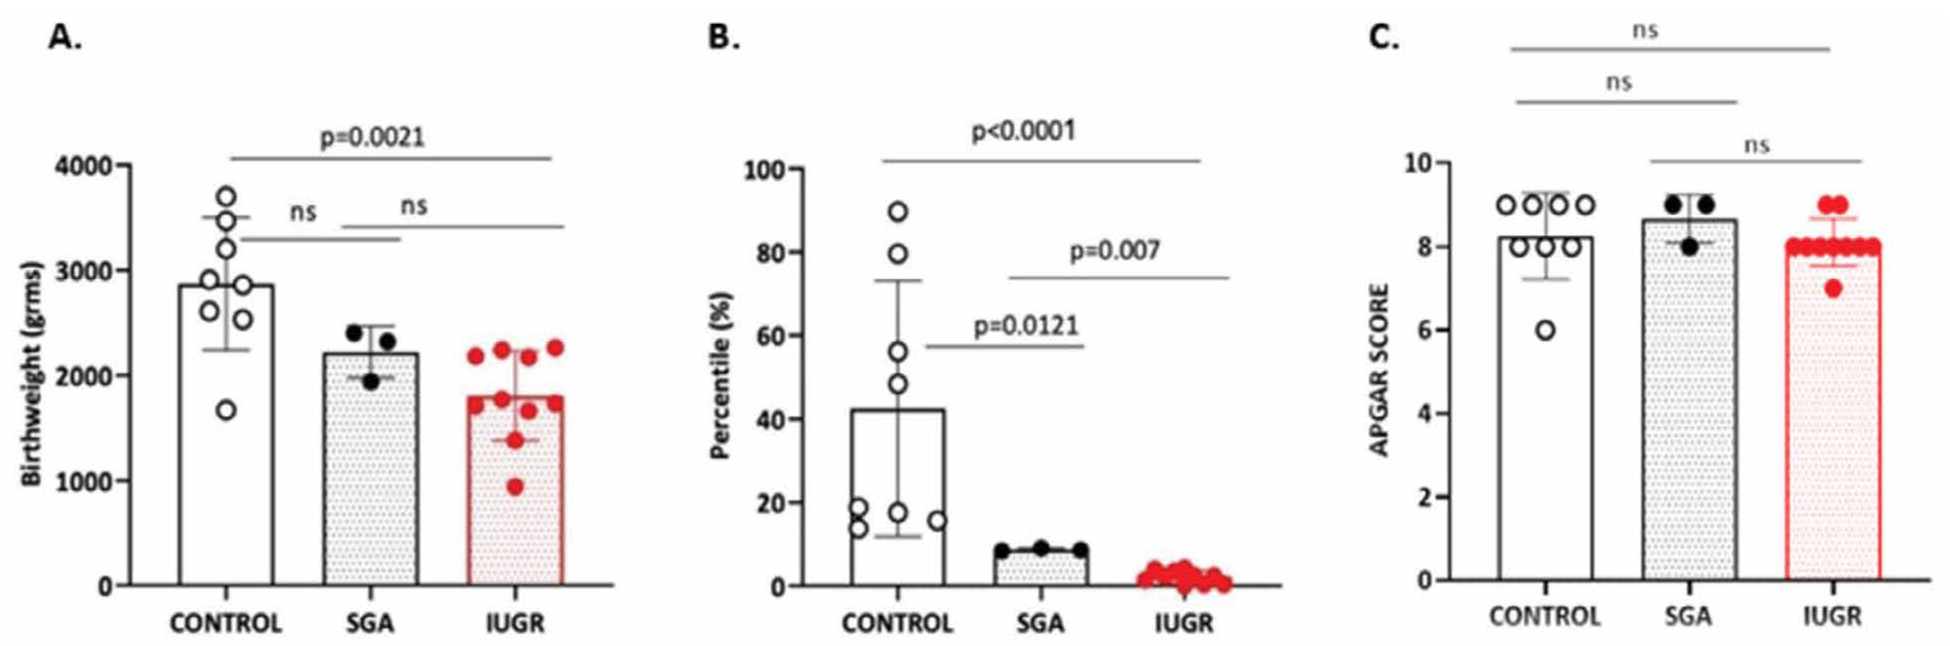
Figure 2. Perinatal Characteristics: A. Birthweight, B. Percentiles and C. APGAR score among three groups of fetuses. Non-parametric Mann-Whitney U-test, two tailed was used to perform statistical analysis. Dots represent individual values from different samples of each source (n=10 IUGR, n=3 SGA and n=8 CONTROL). Statistical differences P >0.05 are referred to as non-significant (ns).
Gene expression characteristics in UC-MSC
Comparative analysis of relative gene expression of IGF2BP1, P21, NANOG, GLI1, OCT, SOX2 and CMYC was performed in P0 and P1 of UC-MSC of CONTROL, SGA and IUGR groups. MSC were phenotypically characterized by flow cytometry based on the negative expression of CD45, CD11B, HLA-DR and positive staining for CD105, CD90, CD44 and CD73 (Figure 3A).
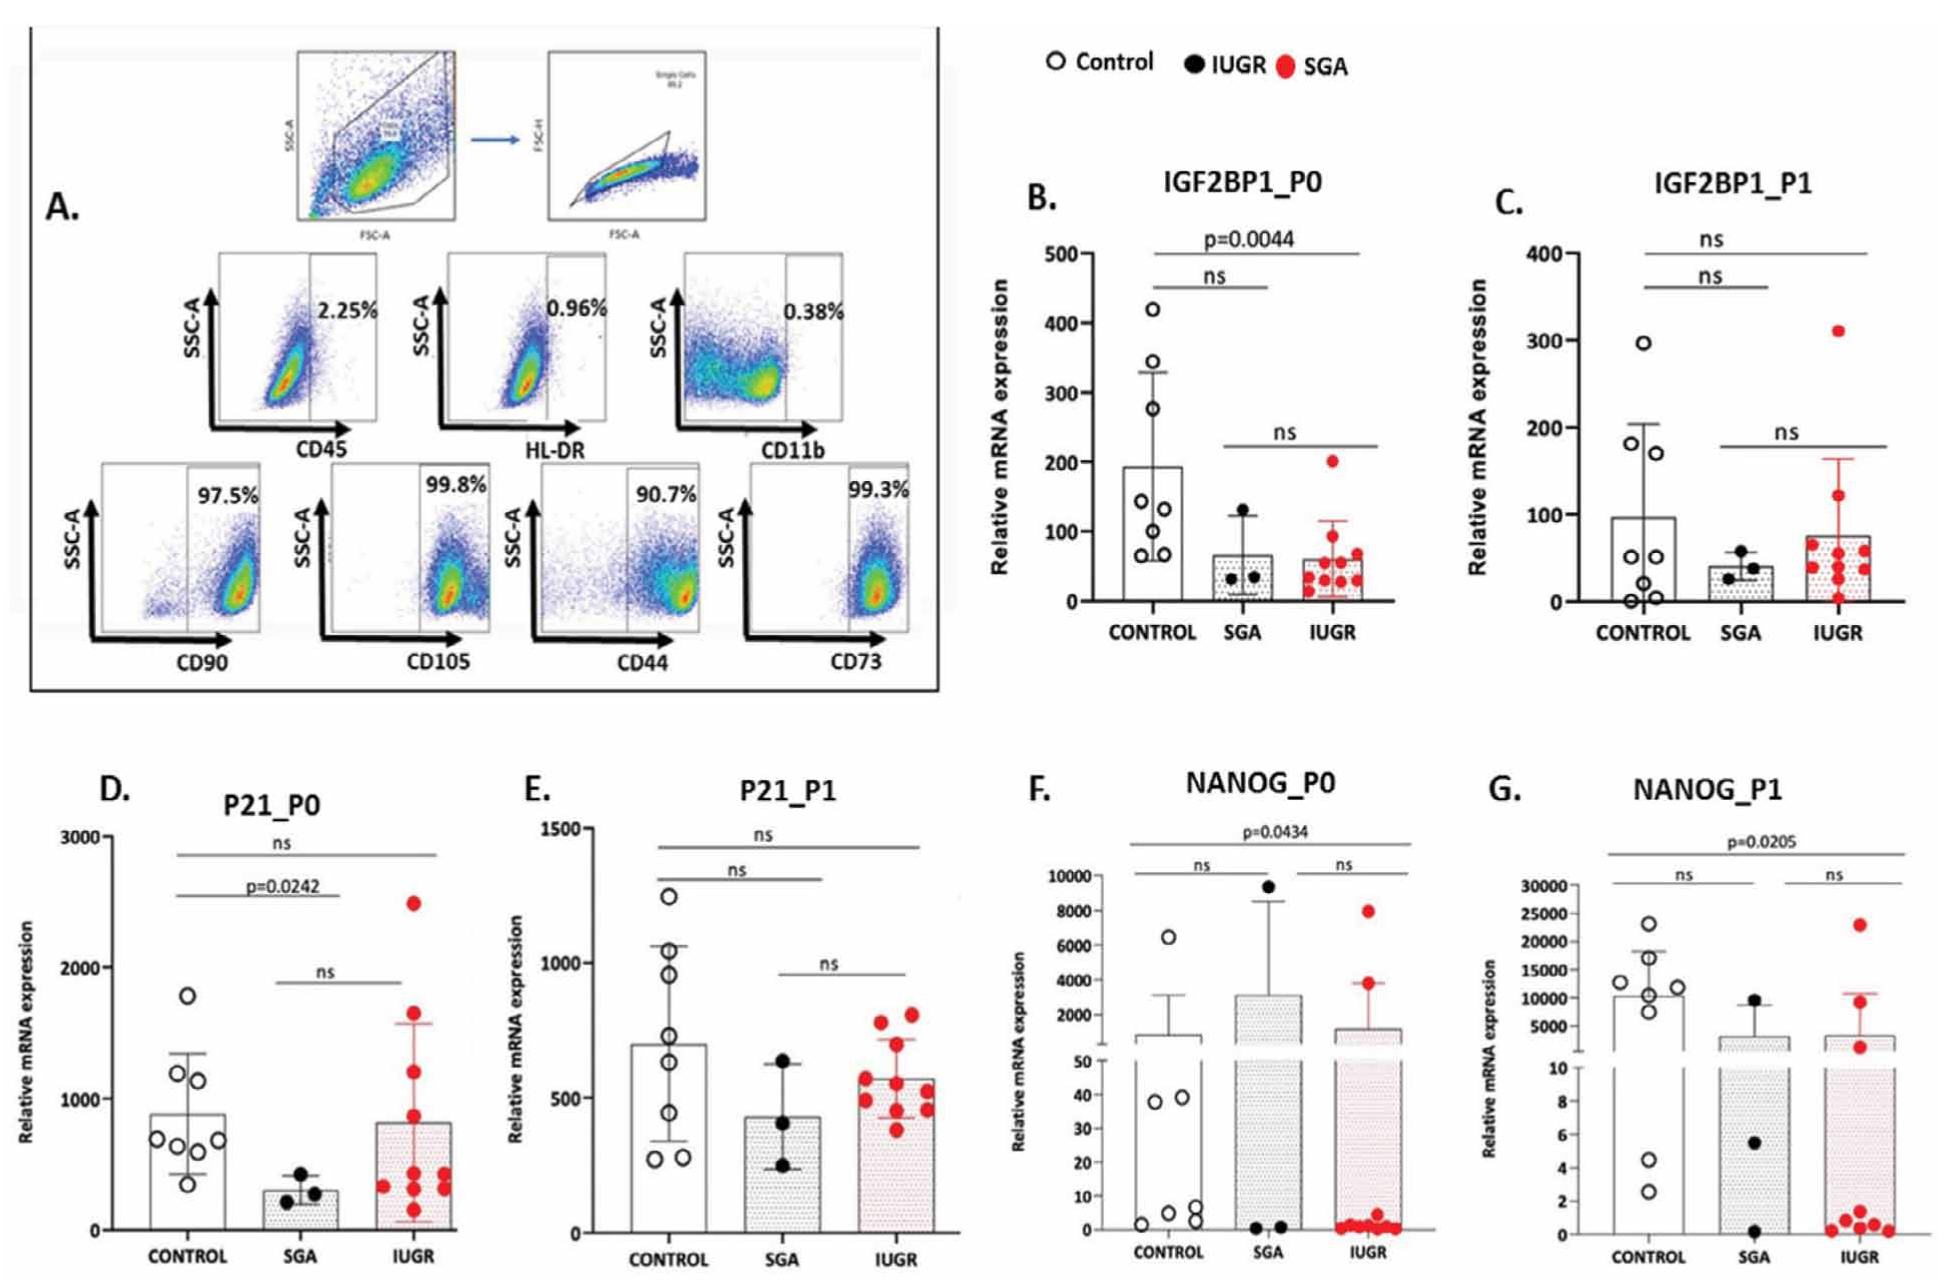
Figure 3. A. Representative Flow Cytometric dot plots for MSC characterization. Phenotypic characterization of MSCs by flow cytometer. Cells were stained for CD45, CD11B, HLA-DR CD105, CD90, CD44 and CD73. B–G. IGF2BP1, P21 and NANOG gene expression in CONTROL, SGA and IUGR groups in P0 and P1 passages. Dots represent individual values from different samples of each source (n=10 IUGR, n=3 SGA and n=8 CONTROL). Non-parametric Mann-Whitney U-test, two tailed was used to perform statistical analysis. Statistical differences P>0.05 are referred to as non-significant (ns).
The median expression of IGF2BP1 differed statistically between CONTROL and IUGR group, only in P0, (IUGR vs CONTROL: 44.37 vs 137.4, P=0.0044, SGA vs CONTROL: 34.44 vs 137.4, P=0.08 and IUGR vs SGA: 44.37 vs 34.44, P=0.69) but not in P1, (IUGR vs CONTROL: 47.53 vs 51.18, P=0.965, SGA vs CONTROL :37.92 vs 51.18, P=0.9212 and IUGR vs SGA : 47,53 vs 37,92, P=0.57) (Figure 3B, 3C). The median expression of P21 in P0 (IUGR vs CONTROL: 428.7 vs 687.1, P=0.359, SGA vs CONTROL: 274.3 vs 687.1, P=0.0242 and IUGR vs SGA: 428.7 vs 274.3, P=0.1608) was different only in CONTROL and SGA group whereas in P1, the median expression of P21 had no differences among all groups (IUGR vs CONTROL: 537.9 vs 680.2, P=0.633, SGA vs CONTROL :406.3 vs 680.2, P=0.278 and IUGR vs SGA: 537.9 vs 406.3, P=0.286) (Figure 3D, 3E). The median NANOG expression differed between CONTROL and IUGR samples in P0 (IUGR vs CONTROL:1.051 vs 22.23, P=0.0434, SGA vs CONTROL: 0.689 vs 22.23, P=0.497 and IUGR vs SGA: 1.051 vs 0.689, P>0,999), which was further potentiated in P1 (IUGR vs CONTROL: 1.090 vs 11136, P=0.0205, SGA vs CONTROL: 5.503 vs 11136, P=0.194 and IUGR vs SGA: 1.090 vs 5.503, P>0,999) (Figure 3F,G).
Furthermore, the median expression of GLI1 in P0 remained unaltered among the three groups (IUGR vs CONTROL: 14.31 vs 19.76, P=0.459, SGA vs CONTROL: 10.30 vs 19.76, P=0.497 and IUGR vs SGA: 14.31 vs 10.30, P=0.937). On the contrary, GLI1 median expression in P1 (IUGR vs CONTROL: 10.91 vs 7170, P=0.0434, SGA vs CONTROL: 17.19 vs 7170, P=0.084 and IUGR vs SGA: 10.91 vs 17.19, P=0.811) varied in the CONTROL vs IUGR group (Figure 4A, 4B). Regarding, median expression of OCT4 in P0 (IUGR vs CONTROL: 0.4584 vs 1.487, P=0.122, SGA vs CONTROL: 0.1615 vs 1.487, P=0.497 and IUGR vs SGA: 0.4584 vs 0.1615, P=0.573) no statistical differences were observed between groups whereas in P1, median expression of OCT4 (IUGR vs CONTROL: 0.3527 vs 1744, P=0.0343, SGA vs CONTROL: 1.279 vs 1744, P=0.278 and IUGR vs SGA: 0.3527 vs 1.279, P>0,999) differed only in the CONTROL vs the IUGR group (Figure 4C, 4D). The median expression of SOX2 in P0 (IUGR vs CONTROL: 2.383 vs 20.01, P=0.0545, SGA vs CONTROL: 2.090 vs 20.01, P=0.497 and IUGR vs SGA: 2.383 vs 2.090, P=0.937) showed no statistical significant differences among the three groups. In addition, the median expression of SOX2 in P1 (IUGR vs CONTROL: 4.403 vs 5546, P=0.2375, SGA vs CONTROL: 5.335 vs 5546, P=0.1939 and IUGR vs SGA: 4.403 vs 5.335, P=0.692) had no differences among the three groups (Figure 4E ,4F).
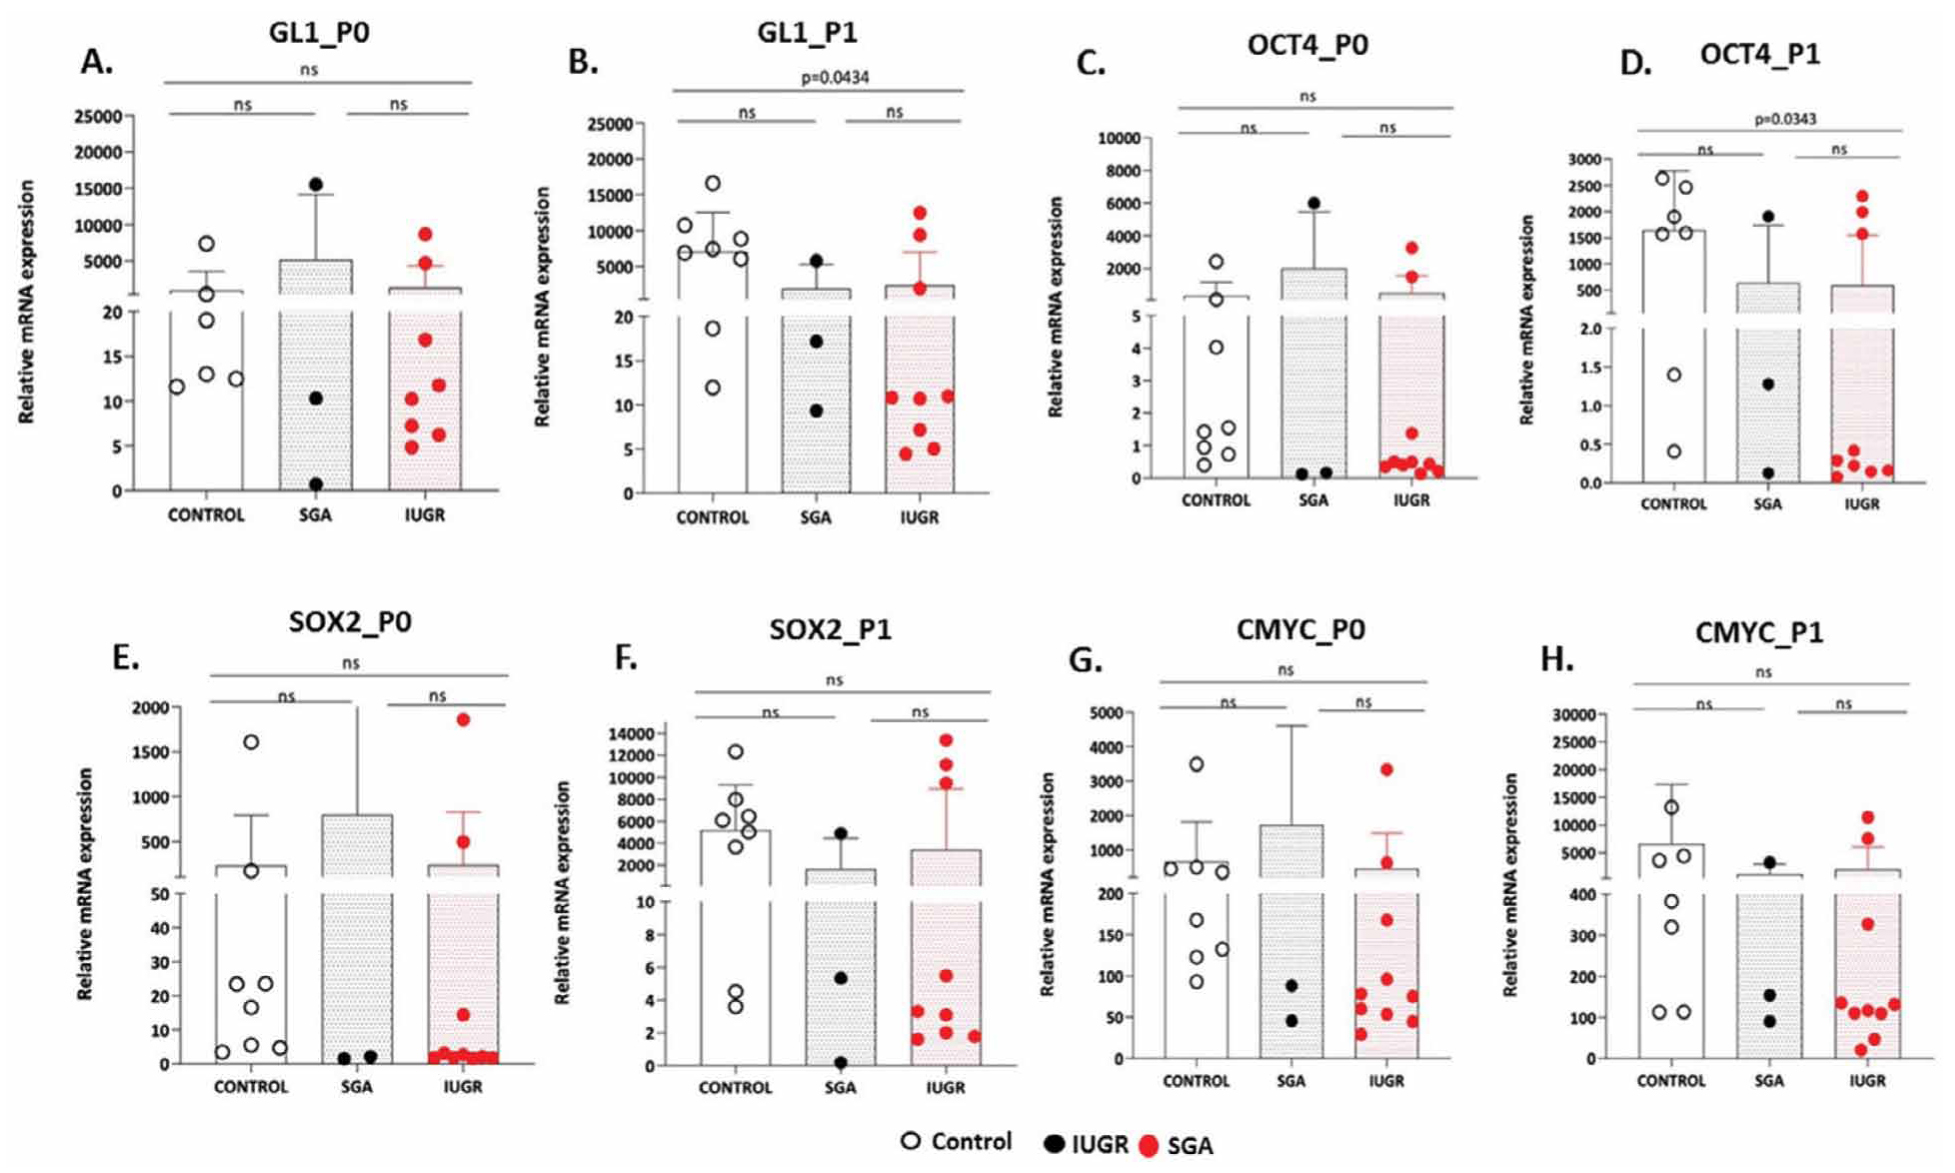
Figure 4. A-H. GL1, OCT4, SOX2 and CMYC gene expression in CONTROL, SGA and IUGR groups in P0 and P1 passages. Dots represent individual values from different samples of each source (n=10 IUGR, n=3 SGA and n=8 CONTROL). Non-parametric Mann-Whitney U-test, two tailed was used to perform statistical analysis. Statistical differences P>0.05 are referred to as non-significant (ns).
Lastly, the median expression of CMYC in P0 (IUGR vs CONTROL: 76.65 vs 261.9, P=0.0545, SGA vs CONTROL: 88.22 vs 261.9, P=0.497 and IUGR vs SGA: 76.65 vs 88.22, P=0.692) and P1 (IUGR vs CONTROL: 124 vs 2009, P=0.1011, SGA vs CONTROL: 154.1 vs 2009, P=0.2788 and IUGR vs SGA: 124 vs 154.1, P=0.8111) showed no statistical variations among the three groups (Figure 4G, 4H).
Discussion
The isolation and culture of mesenchymal stem cells (MSC) from human umbilical cord is a sensitive and laborious process, which requires full-staff laboratory readiness, shortly after baby delivery. IUGR fetuses belong to a rare and special subgroup of cases, which necessitate admission of the mother and close prenatal surveillance of the fetus at specific High-Risk Pregnancy departments. Most unstable IUGR cases with hemodynamic instability and pathologic cardiotocography are delivered in unpredictable hours of the day or weekends. Therefore, the enrolled IUGR cases belong to the more “predictable”, late onset spectrum, shifting the interest to milder clinical phenotypes. For uniformity purposes, enrolled women from SGA and CONTROL group delivered in comparable weeks. Comparative analysis of delivery weight (absolute values expressed in grams) had significant differences only between CONTROL vs IUGR and SGA vs IUGR, but conversion to gestational age-specific percentiles enforced the degree of statistical significance among all groups and confirmed the initial group selection according to the IUGR and SGA definitions. APGAR score had no differences among all groups, reflecting an optimal perinatal care.
Insulin Growth Factor 2 – Binding Protein 1 (IGF2BP1), known as CRD-BP (Coding Region Determinant – Binding Protein) is coded in 17q21.32 and is considered an oncofetal mRNA-binding protein10. It promotes the expansion of plethora of solid tumors, while evidence has shown that is also expressed in large amounts during embryogenesis and neonatal age, but remains silent in adults. De Novo expression is combined with oncogenesis and low survival rate11. Recently, the role of IGF2BP1 has been investigated in lung adenocarcinoma through KRAS signaling, in neuroblastoma through MYC signaling, in ovarian cancer and liver carcinoma12-14. Known mRNA targets of IGF2BP1 are among others CMYC and GLI1. 5’or 3’ untranslated regions of mRNA (3’UTRs) are important for mRNA turnover control, subcellular spatial arrangement for translational prioritization, cellular polarity and cellular migration. IGF2BP1 recently was recognized as a M6A (N6-Methyladenosine) methylation pattern reader with stabilization properties15,16. IGF2BP1 also stabilizes mRNAs rich in AU-rich elements (AREs). The latter are involved in apoptosis, cancer growth, cell cycle regulation and cellular response in stress17,18. In our UC-MSC study, IGF2BP1 median expression differed only in P0 between CONTROL and IUGR. This trend was eliminated in P1, indicating the potential lack of permanent adverse IGF2BP1 epigenetic signatures in IUGR and SGA fetuses.
P21, also known as cyclin-dependent kinase inhibitor 1 is coded in 6p21.2 region and regulates cell transition from G1 to S phase. Elevated levels of expression are related to G0 phase whereas low levels are related to cellular proliferation19. High expression of P21 combined with increased expression of P53 in cancers is related to poor expectancy of life. In our study median P21 expression differed only in P0 between CONTROL vs SGA groups (687.1 vs 274.3, P=0.0242). Therefore, these findings could indicate the lack of permanent adverse P21 epigenetic signatures in IUGR and SGA groups.
NANOG is a transcriptional regulator of inner cell mass during gastrulation in embryogenesis. It is coded in 12p13.31 region and promotes proliferation and self-renewal of the embryonic stems cells (ESC). Acts synergistically with OCT4 and SOX2 genes for the preservation of ESC character20. Several cancer types are NANOG related. In our study median NANOG expression was significantly altered in CONTROL vs IUGR analysis in both P0 and P1 (P=0.04 and P=0.02 respectively). These findings could suggest a potential epigenetic suppression of NANOG expression in UC-MSC derived from IUGR fetuses .
GLI1 is a zinc finger protein, initially isolated from human Glioblastoma cells. It is coded in 12q13.3 region and acts as a transcription enhancer of other transcriptional factors that are involved in the recruiting of Sonic Hedgehog (Hh) signaling cascade. Embryologically is involved in craniofacial morphogenesis, digit formation and central nervous and gastrointestinal system. Several studies have shown that overexpression of GLI1 as a single standing factor may lead to tumorigenesis, especially in skin21. In the current study, GLI1 expression differed only between IUGR vs CONTROL group in P1 (P=0.04). This finding could indicate a trend of potential epigenetic suppression .
Octamer-binding transcription factor 4, OCT4 is also known as POU5F1 (POU domain, class 5, transcription factor 1). It is coded in 6p21.33 region and is a member of the POU (Pit-Oct-Unc) transcription factors. OCT4 is involved in self-renewal processes of undifferentiated embryonic stem cells and along with SOX2 they create a heterodimeric structure on DNA for pluripotence preservation and inner cell mass fate during early morphogenesis. OCT4 is involved in several cancer types in adult life. Embryos with low expression of OCT4 or depletion fail to create inner cell mass and differentiate trophoectoderm, while stem cells lose multipotency22. OCT4 is one of the transcriptional factors (among others SOX2 and CMYC) for the creation of induced pluripotent stem cells (iPSCs)23. Similarly, in the current study, median OCT4 expression had no significant differences among all groups in P0, but a significant IUGR vs CONTROL difference in P1 (P=0.03). In P0 OCT4 expression was in the same order of magnitude in IUGR and SGA and one power of ten higher in CONTROL (IUGR vs CONTROL vs SGA: 0.4584 vs 1.487 vs 0.1615), but in P1 OCT4 expression differed in the CONTROL group by three additional powers of ten (IUGR vs CONTROL vs SGA: 0.3527 vs 1744 vs 1.279) and in the SGA group by one additional power of ten. In IUGR group median OCT4 expression levels are almost identical in P0 and P1 (0.4584 vs 0.3527) indicating a potential epigenetic gene suppression.
SOX2 (SRY BOX2, Sex determining region Y– box2) is a transcriptional factor for the conservation of undifferentiated stem cells. It is coded in 3q26.33 region and is fundamental in nervous system morphogenesis and bronchial tree branching air airway epithelial differentiation. Overexpression of SOX2 is related to epithelial hyperplasia and lung cancer24. SOX2 tumor expression is related to poor response of prostatic cancers to GnRH analogues administration and to poor response of breast cancers to tamoxifen administration25,26. In our study, median SOX2 expression had no significant difference among all groups in P0 and P1. In P0 SOX2 expression was in the same order of magnitude in IUGR and SGA and one power of ten higher in CONTROL (IUGR vs CONTROL vs SGA : 2.383 vs 20.01 vs 2.090), but in P1 SOX2 median expression differed in the CONTROL group by two additional orders of magnitude (IUGR vs CONTROL vs SGA: 4.403 vs 5546 vs 5.335), but there was no statistical power to show any difference .
CMYC is a nuclear phosphoprotein and acts as a transcription factor promoting cell proliferation by decreasing P21 levels and activating HATs (Histone Acetyl- Transferases) which alter epigenetically packed DNA. It is coded in 8q24.21 region and promotes B cell proliferation. CMYC is related to aggressiveness of Burkitt Lymphoma and Multiple Myeloma in case of translocations in coding loci of immunoglobins and CMYC. CMYC is overexpressed in stomach, pancreatic, colon, breast and lung cancer27.Together with aforementioned transcription factors (OCT4, SOX2), is an induction factor for induced pluripotent stem cells (iPSCs) as initially recognized by Yamanaka et al.28. All therapeutic attempts to block CMYC expression directly in several cancers have failed29. In our study, CMYC expression had no significant difference among the various groups in P0 and P1. In P0 CMYC median expression levels were in the same order of magnitude in all groups (IUGR vs CONTROL vs SGA: 76.65 vs 261.9 vs 88.22). In P1 CMYC median expression differed in the control group by one power of ten (IUGR vs CONTROL vs SGA: 124 vs 2009 vs 154.1), but there was no statistical power to show any difference. These findings indicate a trend of potential epigenetic suppression of CMYC gene expression in SGA and IUGR, however more studies are required to further clarify this.
Reconsidering the above mentioned results, we noticed some interesting descriptive patterns. We compared the absolute numbers of median gene expression in P1 in relation to P0. NANOG and OCT4 genes showed a similar exponential increase pattern. Three orders of magnitude (powers of ten) increase in the CONTROL (11136 vs 22.23 for NANOG and 1744 vs 1.487 for OCT4), one power of ten increase in SGA (5.503 vs 0.689 for NANOG and 1.279 vs 0.1615 for OCT4) and same order of magnitude in IUGR (1.090 vs 1.051 for NANOG and 0.3527 vs 0.4584 for OCT4). It is known that NANOG attaches OCT4/POU5F1 promoter region, suppressing P21 levels and inducing cell replication through induction of G1 cell phase. With respect to GLI1, the descriptive pattern is two powers of ten increase in the CONTROL (7170 vs 19.76), and no increase in SGA (17.19 vs 10.30) and IUGR (10.91 vs 14.31). In SOX2, the pattern is two powers of ten increase in the CONTROL (5546 vs 20.01) and just doubling levels in SGA (5.335 vs 2.090) and IUGR (5.335 vs 2.090). Finally, in CMYC the pattern is one power of ten increase in the CONTROL (2009 vs 261.9) and just doubling levels in SGA (154.1 vs 88.22) and IUGR (124 vs 76.65).
Umbilical Cord Mesenchymal Stem Cells (UC-MSC) from pregnancies with normal growth pattern, which consisted the CONTROL group of this study, seem to have in P1 a higher median expression of NANOG, GLI1, OCT4 and differed statistically only from IUGR. SOX2 and CMYC expression in CONTROL vs IUGR group in P1 follow the same trend, although not reaching statistical significance (P<0.05). These genes are gene promoters and strong predictors of stem cell pluripotency and self-renewal potential. Additionally, UC-MSC from SGA fetuses have only a limited compensatory increase of NANOG, GLI1, OCT4, SOX2 and CMYC median expression in P1 but there was no statistical power to show any difference.
This is the first time in clinical medical literature, where adverse intrauterine nutritional conditions seem to affect the in vitro expression of some pluripotency genes in re-cultured human UC-MSC. These findings could possibly be attributed to epigenetic adaptation in IUGR and to a lesser degree in SGA-derived cells due to poor intrauterine nutritional conditions, a cellular analogue of “thrived-phenotype” hypothesis formulated by Barker et al. four decades ago4.
This observation could be of immense importance when it comes to potential clinical implications. UC-MSC from IUGR and SGA fetuses could have poor culturing and regenerative potential in medicine of tissue scaffolding and engineering. Meanwhile, the proposed epigenetic adaptations in these cells could be advantageous in stem cell-based therapeutic protocols. The described stem cells could potentially retain homing properties in stem-cell based clinical protocols without promoting unnecessary angiogenesis and harmful paracrine action30-35. Additionally, these data could provide novel prediction tools for the management of IUGR pregnancies and the designing of better therapeutic approaches .The sample size for the SGA group is only 3, which raises concerns regarding the ability to draw robust comparative conclusions between SGA and the other two groups. As previously referred, IUGR and AGA fetuses consist clearly delineated clinical entities and SGA group consist of a marginal and transitional clinical zone. In this study, we used SGA mostly for descriptive reasons. More studies with higher numbers of samples are required to further investigate this hypothesis.
Conclusion
IUGR remains a clinical challenge due to prematurity, low birth weight and poor perinatal outcome. SGA consists of a transient clinical group of low birth weight fetuses. We found that poor nutritional status of IUGR and SGA fetuses seem to influence the expression of some pluripotency genes in the collected UC-MSC, indicating potential epigenetic alterations or signatures. It is possible that this could further affect their qualitative characteristics and their future exploitation therapeutically. Current clinical applications of UC-MSCs have contradictory results. Here, we also propose the need to further elucidate this hypothesis after conducting more studies, with higher numbers of samples and passages of UC-MSC from IUGR and SGA fetuses
Author Contributions
P.F. and L.M. conceived of the presented idea. P.F. collected the samples. S.F. carried out the experiments. P.F. and M.S. contributed to the analysis of the results. P.F. wrote the manuscript. A.A., K.P., G.D., N.P., and V.P. provided critical feedback.
Funding
This research received no external funding
Institutional Review Board Statement
The study was conducted in accordance with the Declaration of Helsinki, and approved by the Ethical and Scientific Committee of Alexandra General Hospital and University of Athens IRB (IRB-ID 005/16.05.2013).
Informed Consent Statement
Informed consent was obtained from all subjects involved in the study.
Conflicts of Interest
The authors declare no conflict of interest.
References
- Figueras F, Gratacós E. Update on the diagnosis and classification of fetal growth restriction and proposal of a stage- based management protocol. Fetal Diagn Ther 2014; 36:86–98. doi: 10.1159/000357592. Epub 2014 Jan 23. PMID: 24457811.
- Barker DJ, Osmond C, Golding J, Kuh D, Wadsworth ME. Growth in utero, blood pressure in childhood and adult life, and mortality from cardiovascular disease. BMJ. 1989 Mar 4;298(6673):564-7. doi: 10.1136/bmj.298.6673.564. PMID: 2495113; PMCID: PMC1835925.
- Hales CN, Barker DJ. The thrifty phenotype hypothesis. Br Med Bull. 2001;60:5-20. doi: 10.1093/bmb/60.1.5. PMID: 11809615.
- Barker DJ, Hales CN, Fall CH, Osmond C, Phipps K, Clark PM. Type 2 (non-insulin-dependent) diabetes mellitus, hypertension and hyperlipidaemia (syndrome X): relation to reduced fetal growth. Diabetologia. 1993 Jan;36(1):62-7. doi: 10.1007/BF00399095. PMID: 8436255.
- Dessì A, Atzori L, Noto A, Visser GH, Gazzolo D, Zanardo V, Barberini L, Puddu M, Ottonello G, Atzei A, De Magistris A, Lussu M, Murgia F, Fanos V. Metabolomics in newborns with intrauterine growth retardation (IUGR): urine reveals markers of metabolic syndrome. J Matern Fetal Neonatal Med. 2011 Oct; 24 Suppl 2:35-9. doi: 10.3109/14767058.2011.605868. PMID: 21767100.
- Favretto D, Cosmi E, Ragazzi E, Visentin S, Tucci M, Fais P, Cecchetto G, Zanardo V, Viel G, Ferrara SD. Cord blood metabolomic profiling in intrauterine growth restriction. Anal Bioanal Chem. 2012 Jan;402(3):1109-21. doi: 10.1007/s00216-011-5540-z. Epub 2011 Nov 19. PMID: 22101423.
- Friedenstein AJ, Gorskaja JF, Kulagina NN. Fibroblast precursors in normal and irradiated mouse hematopoietic organs. Exp Hematol. 1976 Sep;4(5):267-74. PMID: 976387.
- Lin W, Huang L, Li Y, Fang B, Li G, Chen L, Xu L. Mesenchymal Stem Cells and Cancer: Clinical Challenges and Opportunities. Biomed Res Int. 2019 May 8;2019:2820853. doi: 10.1155/2019/2820853. PMID: 31205939; PMCID: PMC6530243.
- Mahaira LG, Katsara O, Pappou E, Iliopoulou EG, Fortis S, Antsaklis A, Fotinopoulos P, Baxevanis CN, Papamichail M, Perez SA. IGF2BP1 expression in human mesenchymal stem cells significantly affects their proliferation and is under the epigenetic control of TET1/2 demethylases. Stem Cells Dev. 2014 Oct 15;23(20):2501-12. doi: 10.1089/scd.2013.0604. Epub 2014 Jul 14. PMID: 24915579.
- Glaß M, Misiak D, Bley N, Müller S, Hagemann S, Busch B, Rausch A, Hüttelmaier S. IGF2BP1, a Conserved Regulator of RNA Turnover in Cancer. Front MolBiosci. 2021 Mar 22;8:632219. doi: 10.3389/fmolb.2021.632219. PMID: 33829040; PMCID: PMC8019740.
- Dimitriadis E, Trangas T, Milatos S, Foukas PG, Gioulbasanis I, Courtis N, Nielsen FC, Pandis N, Dafni U, Bardi G, Ioannidis P. Expression of oncofetal RNA-binding protein CRD-BP/IMP1 predicts clinical outcome in colon cancer. Int J Cancer. 2007 Aug 1;121(3):486-94. doi: 10.1002/ijc.22716. PMID: 17415713.
- Rosenfeld YB, Krumbein M, Yeffet A, Schiffmann N, Mishalian I, Pikarsky E, Oberman F, Fridlender Z, Yisraeli JK. VICKZ1 enhances tumor progression and metastasis in lung adenocarcinomas in mice. Oncogene. 2019 May; 38(21):4169-4181. doi: 10.1038/s41388-019-0715-8. Epub 2019 Jan 30. PMID: 30700831.
- Köbel M, Weidensdorfer D, Reinke C, Lederer M, Schmitt WD, Zeng K, Thomssen C, Hauptmann S, Hüttelmaier S. Expression of the RNA-binding protein IMP1 correlates with poor prognosis in ovarian carcinoma. Oncogene. 2007 Nov 29;26(54):7584-9. doi: 10.1038/sj.onc.1210563. Epub 2007 Jun 4. PMID: 17546046.
- Gutschner T, Hämmerle M, Pazaitis N, Bley N, Fiskin E, Uckelmann H, Heim A, Groβ M, Hofmann N, Geffers R, Skawran B, Longerich T, Breuhahn K, Schirmacher P, Mühleck B, Hüttelmaier S, Diederichs S. Insulin-like growth factor 2 mRNA-binding protein 1 (IGF2BP1) is an important protumorigenic factor in hepatocellular carcinoma. Hepatology. 2014 May;59(5):1900-11. doi: 10.1002/hep.26997. Epub 2014 Apr 1. PMID: 24395596.
- Huang H, Weng H, Sun W, Qin X, Shi H, Wu H, Zhao BS, Mesquita A, Liu C, Yuan CL, Hu YC, Hüttelmaier S, Skibbe JR, Su R, Deng X, Dong L, Sun M, Li C, Nachtergaele S, Wang Y, Hu C, Ferchen K, Greis KD, Jiang X, Wei M, Qu L, Guan JL, He C, Yang J, Chen J. Recognition of RNA N6-methyladenosine by IGF2BP proteins enhances mRNA stability and translation. Nat Cell Biol. 2018 Mar;20(3):285-295. doi: 10.1038/s41556-018-0045-z. Epub 2018 Feb 23. Erratum in: Nat Cell Biol. 2018 Sep;20(9):1098. Erratum in: Nat Cell Biol. 2020 Oct;22(10):1288. PMID: 29476152; PMCID: PMC5826585.
- Müller S, Glaß M, Singh AK, Haase J, Bley N, Fuchs T, Lederer M, Dahl A, Huang H, Chen J, Posern G, Hüttelmaier S. IGF2BP1 promotes SRF-dependent transcription in cancer in a m6A- and miRNA-dependent manner. Nucleic Acids Res. 2019 Jan 10;47(1):375-390. doi: 10.1093/nar/gky1012. PMID: 30371874; PMCID: PMC6326824.
- Bakheet T, Williams BR, Khabar KS. ARED 3.0: the large and diverse AU-rich transcriptome. Nucleic Acids Res. 2006 Jan 1;34(Database issue):D111-4. doi: 10.1093/nar/gkj052. PMID: 16381826; PMCID: PMC1347415.
- Bell JL, Wächter K, Mühleck B, Pazaitis N, Köhn M, Lederer M, Hüttelmaier S. Insulin-like growth factor 2 mRNA-binding proteins (IGF2BPs): post-transcriptional drivers of cancer progression? Cell Mol Life Sci. 2013 Aug;70(15):2657-75. doi: 10.1007/s00018-012-1186-z. Epub 2012 Oct 16. PMID: 23069990; PMCID: PMC3708292.
- Barr AR, Cooper S, Heldt FS, Butera F, Stoy H, Mansfeld J, Novák B, Bakal C. DNA damage during S-phase mediates the proliferation-quiescence decision in the subsequent G1 via p21 expression. Nat Commun. 2017 Mar 20;8:14728. doi: 10.1038/ncomms14728. PMID: 28317845; PMCID: PMC5364389.
- Hayashi Y, Caboni L, Das D, Yumoto F, Clayton T, Deller MC, Nguyen P, Farr CL, Chiu HJ, Miller MD, Elsliger MA, Deacon AM, Godzik A, Lesley SA, Tomoda K, Conklin BR, Wilson IA, Yamanaka S, Fletterick RJ. Structure-based discovery of NANOG variant with enhanced properties to promote self-renewal and reprogramming of pluripotent stem cells. Proc Natl AcadSci U S A. 2015 Apr 14;112(15):4666-71. doi: 10.1073/pnas.1502855112. Epub 2015 Mar 30. PMID: 25825768; PMCID: PMC4403148.
- Dahmane N, Lee J, Robins P, Heller P, Ruiz iAltaba A. Activation of the transcription factor Gli1 and the Sonic hedgehog signalling pathway in skin tumours. Nature. 1997 Oct 23;389(6653):876-81. doi: 10.1038/39918. Erratum in: Nature 1997 Dec 4;390(6659):536. PMID: 9349822.
- Fogarty NME, McCarthy A, Snijders KE, Powell BE, Kubikova N, Blakeley P, Lea R, Elder K, Wamaitha SE, Kim D, Maciulyte V, Kleinjung J, Kim JS, Wells D, Vallier L, Bertero A, Turner JMA, Niakan KK. Genome editing reveals a role for OCT4 in human embryogenesis. Nature. 2017 Oct 5;550(7674):67-73. doi: 10.1038/nature24033. Epub 2017 Sep 20. Erratum in: Nature. 2017 Oct 04;: PMID: 28953884; PMCID: PMC5815497.
- Velychko S, Adachi K, Kim KP, Hou Y, MacCarthy CM, Wu G, Schöler HR. Excluding Oct4 from Yamanaka Cocktail Unleashes the Developmental Potential of iPSCs. Cell Stem Cell. 2019 Dec 5;25(6):737-753.e4. doi: 10.1016/j.stem.2019.10.002. Epub 2019 Nov 7. PMID: 31708402; PMCID: PMC6900749.
- Lu Y, Futtner C, Rock JR, Xu X, Whitworth W, Hogan BL, Onaitis MW. Evidence that SOX2 overexpression is oncogenic in the lung. PLoS One. 2010 Jun 10;5(6):e11022. doi: 10.1371/journal.pone.0011022. PMID: 20548776; PMCID: PMC2883553.
- Kregel S, Kiriluk KJ, Rosen AM, Cai Y, Reyes EE, Otto KB, Tom W, Paner GP, Szmulewitz RZ, Vander Griend DJ. Sox2 is an androgen receptor-repressed gene that promotes castration-resistant prostate cancer. PLoS One. 2013;8(1):e53701. doi: 10.1371/journal.pone.0053701. Epub 2013 Jan 11. PMID: 23326489; PMCID: PMC3543364.
- Piva M, Domenici G, Iriondo O, Rábano M, Simões BM, Comaills V, Barredo I, López-Ruiz JA, Zabalza I, Kypta R, Vivanco Md. Sox2 promotes tamoxifen resistance in breast cancer cells. EMBO Mol Med. 2014 Jan;6(1):66-79. doi: 10.1002/emmm.201303411. PMID: 24178749; PMCID: PMC3936493.
- Chen Y, McGee J, Chen X, Doman TN, Gong X, Zhang Y, Hamm N, Ma X, Higgs RE, Bhagwat SV, Buchanan S, Peng SB, Staschke KA, Yadav V, Yue Y, Kouros-Mehr H. Identification of druggable cancer driver genes amplified across TCGA datasets. PLoS One. 2014 May 29;9(5):e98293. doi: 10.1371/journal.pone.0098293. Erratum in: PLoS One. 2014;9(9):e107646. PMID: 24874471; PMCID: PMC4038530.
- Takahashi K, Yamanaka S. A decade of transcription factor-mediated reprogramming to pluripotency. Nat Rev Mol Cell Biol. 2016 Mar;17(3):183-93. doi: 10.1038/nrm.2016.8. Epub 2016 Feb 17. PMID: 26883003.
- Carabet LA, Rennie PS, Cherkasov A. Therapeutic Inhibition of Myc in Cancer. Structural Bases and Computer-Aided Drug Discovery Approaches. Int J Mol Sci. 2018 Dec 29;20(1):120. doi: 10.3390/ijms20010120. PMID: 30597997; PMCID: PMC6337544.
- Dominici M, Le Blanc K, Mueller I, Slaper-Cortenbach I, Marini F, Krause D, Deans R, Keating A, ProckopDj, Horwitz E. Minimal criteria for defining multipotent mesenchymal stromal cells. The International Society for Cellular Therapy position statement. Cytotherapy. 2006;8(4):315-7. doi: 10.1080/14653240600855905. PMID: 16923606.
- Kim SM, Oh JH, Park SA, Ryu CH, Lim JY, Kim DS, Chang JW, Oh W, Jeun SS. Irradiation enhances the tumor tropism and therapeutic potential of tumor necrosis factor-related apoptosis-inducing ligand-secreting human umbilical cord blood-derived mesenchymal stem cells in glioma therapy. Stem Cells. 2010 Dec;28(12):2217-28. doi: 10.1002/stem.543. PMID: 20945331.
- Brown C, McKee C, Bakshi S, Walker K, Hakman E, Halassy S, Svinarich D, Dodds R, Govind CK, Chaudhry GR. Mesenchymal stem cells: Cell therapy and regeneration potential. J Tissue Eng Regen Med. 2019 Sep;13(9):1738-1755. doi: 10.1002/term.2914. Epub 2019 Jul 25. PMID: 31216380.
- Bajetto A, Pattarozzi A, Sirito R, Barbieri F, Florio T. Metformin potentiates immunosuppressant activity and adipogenic differentiation of human umbilical cord-mesenchymal stem cells. IntImmunopharmacol. 2023 Nov;124(Pt B):111078. doi: 10.1016/j.intimp.2023.111078. Epub 2023 Oct 14. PMID: 37844465.
- Sun L, Yang N, Chen B, Bei Y, Kang Z, Zhang C, Zhang N, Xu P, Yang W, Wei J, Ke J, Sun W, Li X, Shen P. A novel mesenchymal stem cell-based regimen for acute myeloid leukemia differentiation therapy. Acta Pharm Sin B. 2023 Jul;13(7):3027-3042. doi: 10.1016/j.apsb.2023.05.007. Epub 2023 May 16. PMID: 37521858; PMCID: PMC10372914.
- Soliman AH, Abdellatif M. COVID-19 disease treatment: pivotal challenges in the arena of umbilical cord-mesenchymal stem cells (UC-MSCs). Front Cell Dev Biol. 2023 May 19;11:1146835. doi: 10.3389/fcell.2023.1146835. PMID: 37274737; PMCID: PMC10235792.